The road we are monitoring
We are monitoring the stretch of Heighington Road in Canwick, Lincolnshire, that starts before the children's play-park gate on Canwick playing field, and ends just beyond Grange Lane, well before the speed limit increases to 60 mph after leaving the village.
The road has a pedestrian path on the housing side of the road, opposite the playing field. Four roads turn onto this stretch, coming out of the village. It is currently a 40 mph speed limit for this stretch of road.
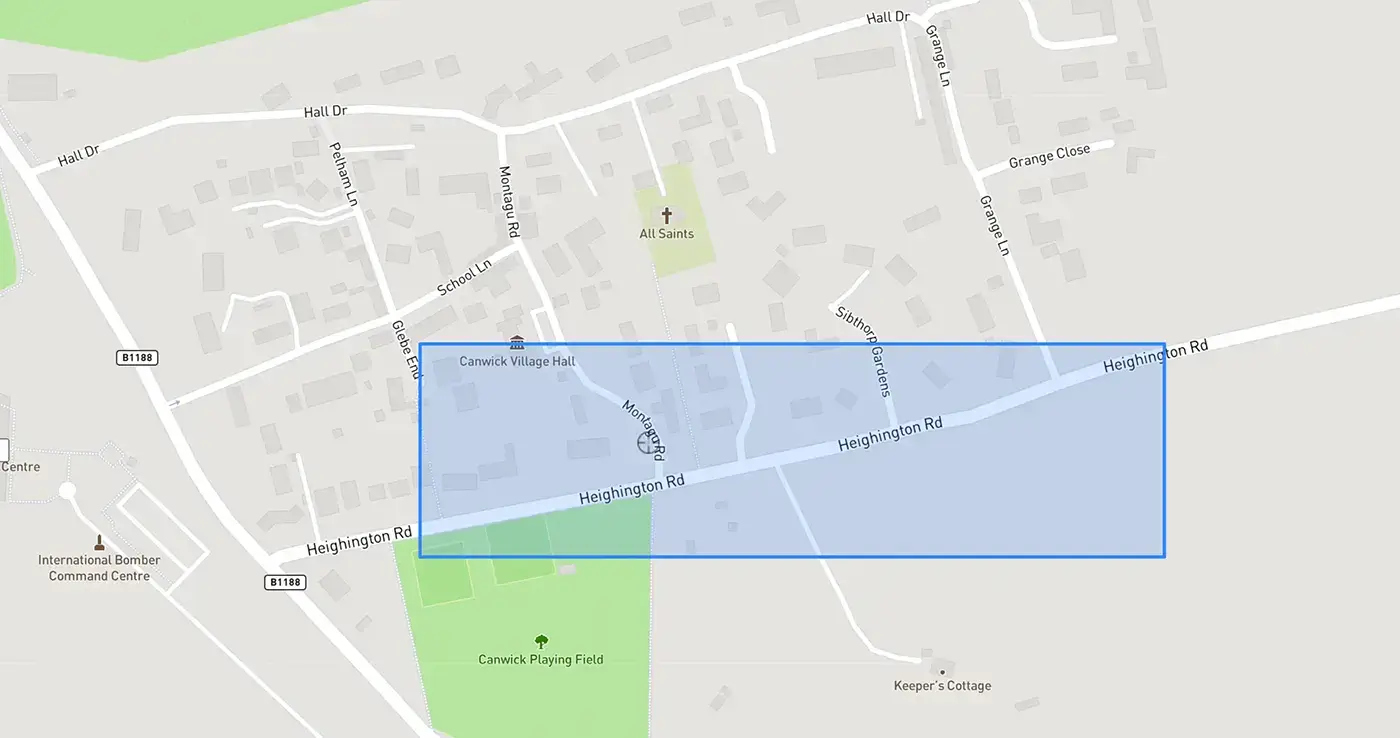
Coordinates (West, South, East, North): -0.5250931027, 53.2132306686, -0.5178930479, 53.214463819
Reference: http://bboxfinder.com/#53.213231,-0.525093,53.214464,-0.517893
The concern
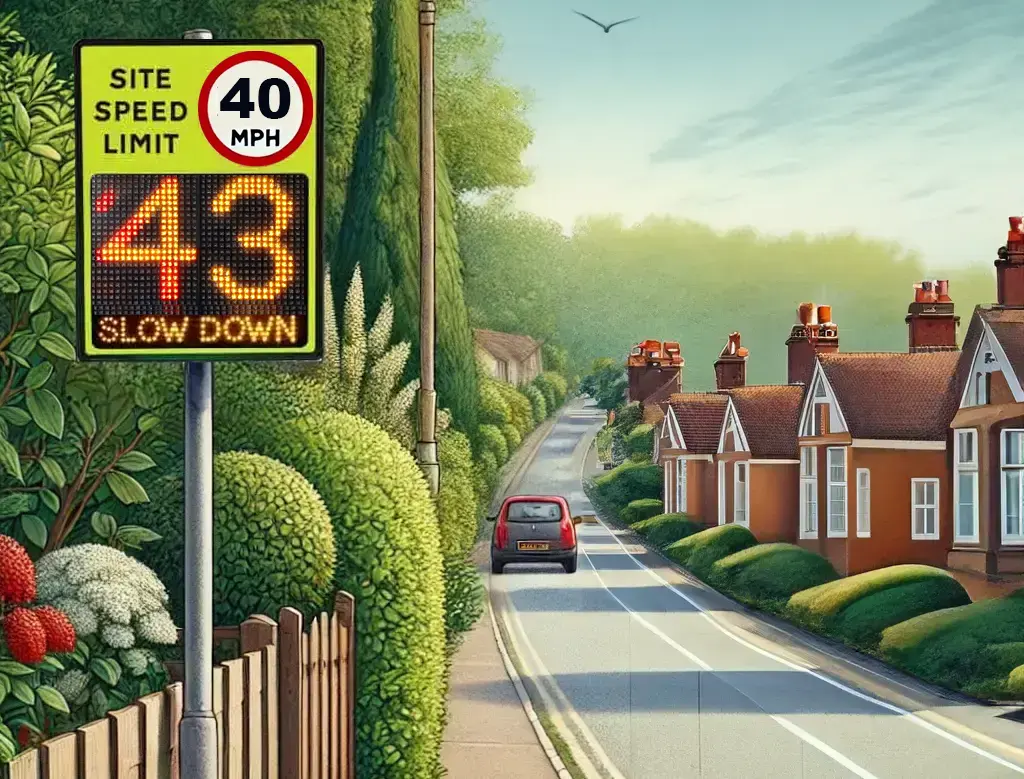
Typically, a speed limit of 30 mph will apply to a residential road with street lighting (ref: GOV.UK website), especially in a village and next to a park / playing field. However, this stretch of road has a speed limit of 40 mph, presumably due to the volume of traffic that flows in both directions, to neighbouring villages or into the city of Lincoln.
In addition to the unusually high speed limit for the area, the stretch has no traffic calming, no speed detection, no cameras or deterrents, causing residents and visitors of the village to be concerned with safety.
Safety for drivers: It's widely noted by residents that it's difficult to exit any of the 4 side roads that lead onto Heighington Road, because of high walls, hedges and a slight bend in the road, meaning they are all quite blind turnings and therefore dangerous.
Safety for pedestrians: The Canwick playing field has two gates, both of which lead directly onto the road itself, because you must cross the road to get back to the pedestrian pathway. There is significant concern for safety for those accessing or leaving the park, especially children and those less mobile.
The purpose
We are monitoring this stretch of road to gather data to accurately analyse the traffic; real vehicle speeds, average speeds, the number of those exceeding the limit and by how much, the number of those travelling closer to what they may reasonably assume to be a 30 mph limit, the differences between rush-hour and usual traffic, and much more.
Once we have a rich set of data, we can present this to the local authority if it is clear that change needs to happen for safety purposes, supporting our concerns with facts.
Ultimately, our aim is to avoid a tragedy, with Lincolnshire's road traffic statistics quite consistently bad year on year - shown below.
Lincolnshire Road Traffic
Reference: Lincs County Council
2023
Deaths or Serious injuries: 426Collisions: 1,726
2022
Deaths or Serious injuries: 439Collisions: 1,604
2021
Deaths or Serious injuries: 453Collisions: 1,527
Speed calculations
The HERE.com Traffic API (v7) gathers data from companies providing location services. The GPS signals from drivers’ mobile devices are used to measure their speed while on the road. Here's an article from Halfords about the accuracy of GPS for measuring speed.
The data is provided in m/s (meters per second). We store this data as it is. However, for clarity we convert the speed to display in mph (miles per hour), using the following equation:

Therefore, each speed calculation is based on: speed in m/s x 2.23694.
We also display the percentage (%) over / under the 40 mph speed limit that the traffic was travelling at. We calculate this using ((speed in mph - 40) / 40 mph) x 100.
Data gathered
In the table below, you will find the data we have stored. The data is snapshots of traffic on the road when we request it - that might be several vehicles, it might be one, it might be none. The speed is an aggregate of that snapshot.
We began collecting data on Friday 4th October, 2024. By default, the data displays for yesterday's date, so you see a full day of data. You can search any day using the date picker shown.
Schedule:
To get a rich dataset while maintaining budget friendly, we are requesting data more frequently in busier times on weekdays. Between 06:30 and 09:00, and between 15:30 and 18:00, we get a snapshot every 3 minutes. From 09:00 to 15:30 we reduce to every 6 minutes. On weekends between 06:30 and 18:30, we get a snapshot every 8 minutes.
This amounts to 4,785 snapshots over a long month.
In the initial trial period of 04/10/24 until 29/10/24, the data was set to request and store every 6 minutes, between the hours of 06:30 and 22:30 every day, including weekends.
Tolerance:
We only indicate speeds of 44 mph or greater in red - speeds exceeding 43 mph are what the local authority consider to be appropriate for a 50 mph limit (reference: Lincolnshire Speed Limit Policy - Page 9: Section 3.7), therefore they would be unacceptable for a 40 mph speed limit. To illiminate collecting data for the side roads that intersect within the boundary we are monitoring, we only store speeds of 25mph or above.
A few statistics
for 59 entries recorded on 22/06/2026
44 mph For all time:
42 mph
49% For all time:
41%